Lead UX Designer/Architect
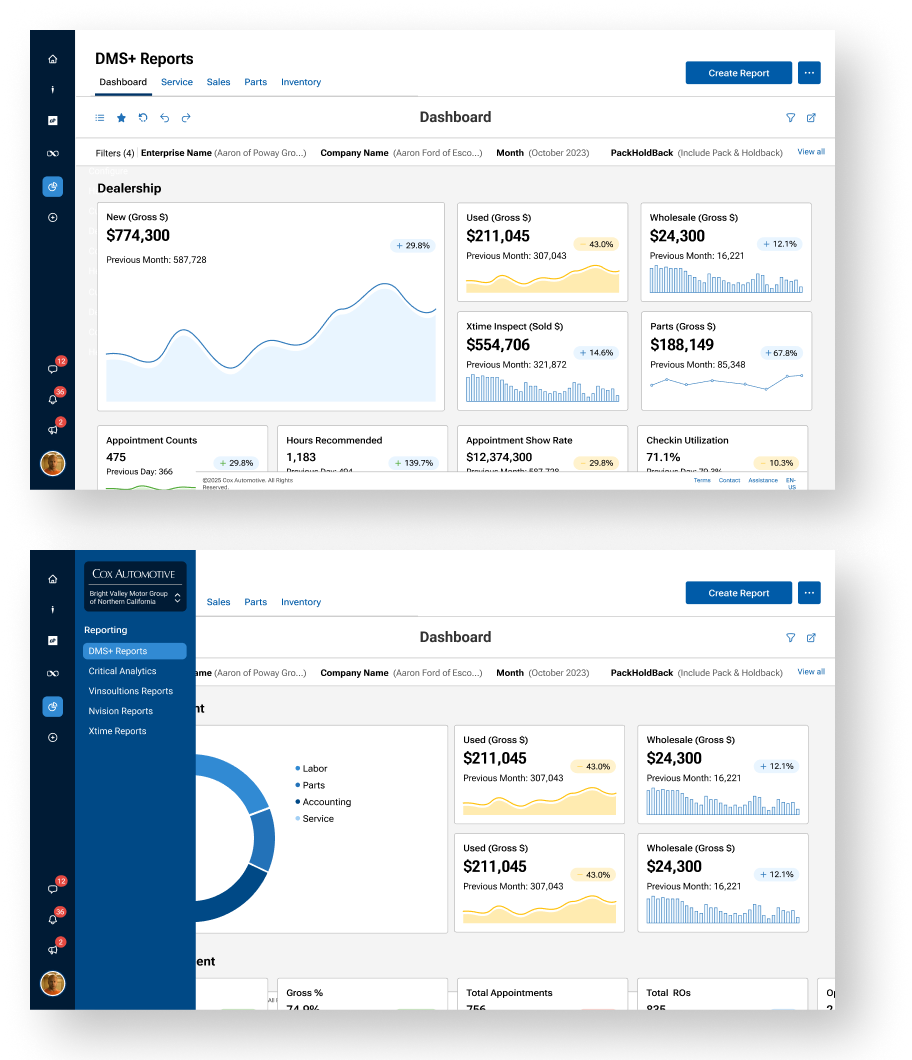
I led product strategy, UX leadership, and systems architecture for a reporting ecosystem spanning multiple dealership workflows and product lines.
- Product Strategy
- UX Leadership
- Systems Architecture
- Discovery Facilitation
- Interaction Design
- Design Direction
- Cross-functional Alignment
Organizational Challenge
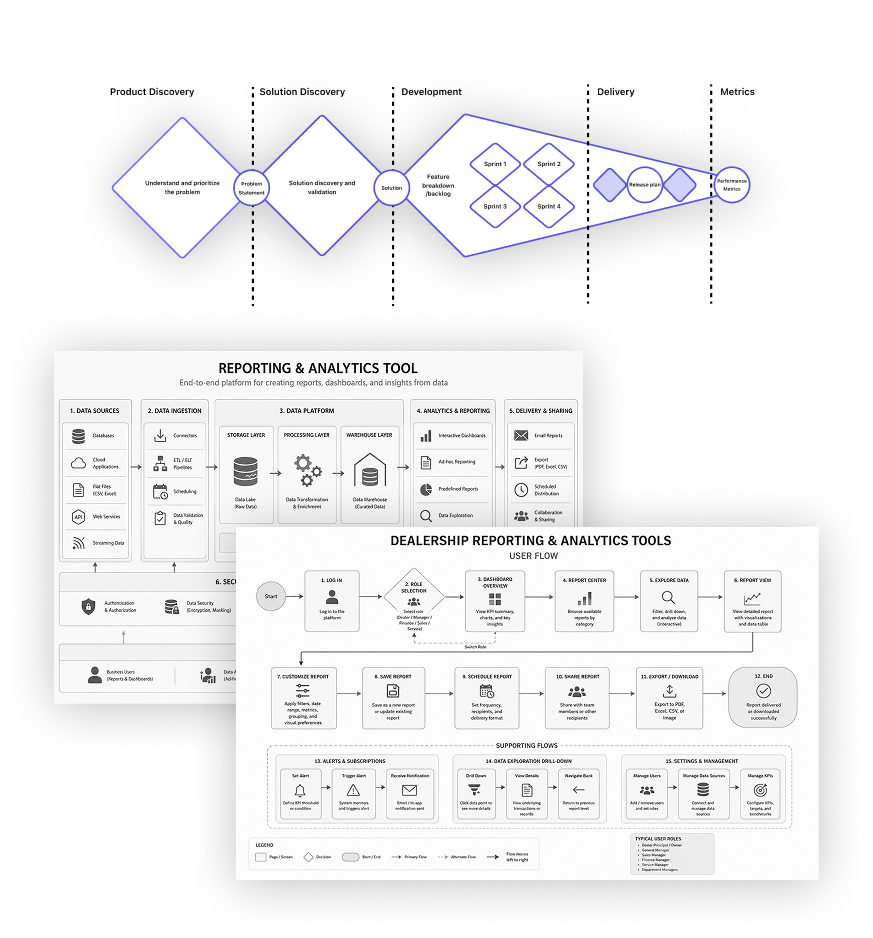
This initiative evolved from a dashboard redesign into a platform-level effort to unify fragmented reporting systems across Cox Automotive's dealership ecosystem.
- Inconsistent reporting definitions, workflows, and interaction models across products
- Siloed ownership between teams created operational fragmentation and low reporting trust
- Manual reconciliation and legacy workflows increased cognitive and operational overhead
- Competing priorities between customization, usability, delivery speed, and scalability
The challenge was not consolidating dashboards — it was aligning teams around a shared operational reporting model that could scale across products, workflows, and dealership roles.
- Standardized reporting principles
- Scalable interaction patterns
- Unified workflow behaviors
- Cross-functional alignment across product, engineering, and operational stakeholders
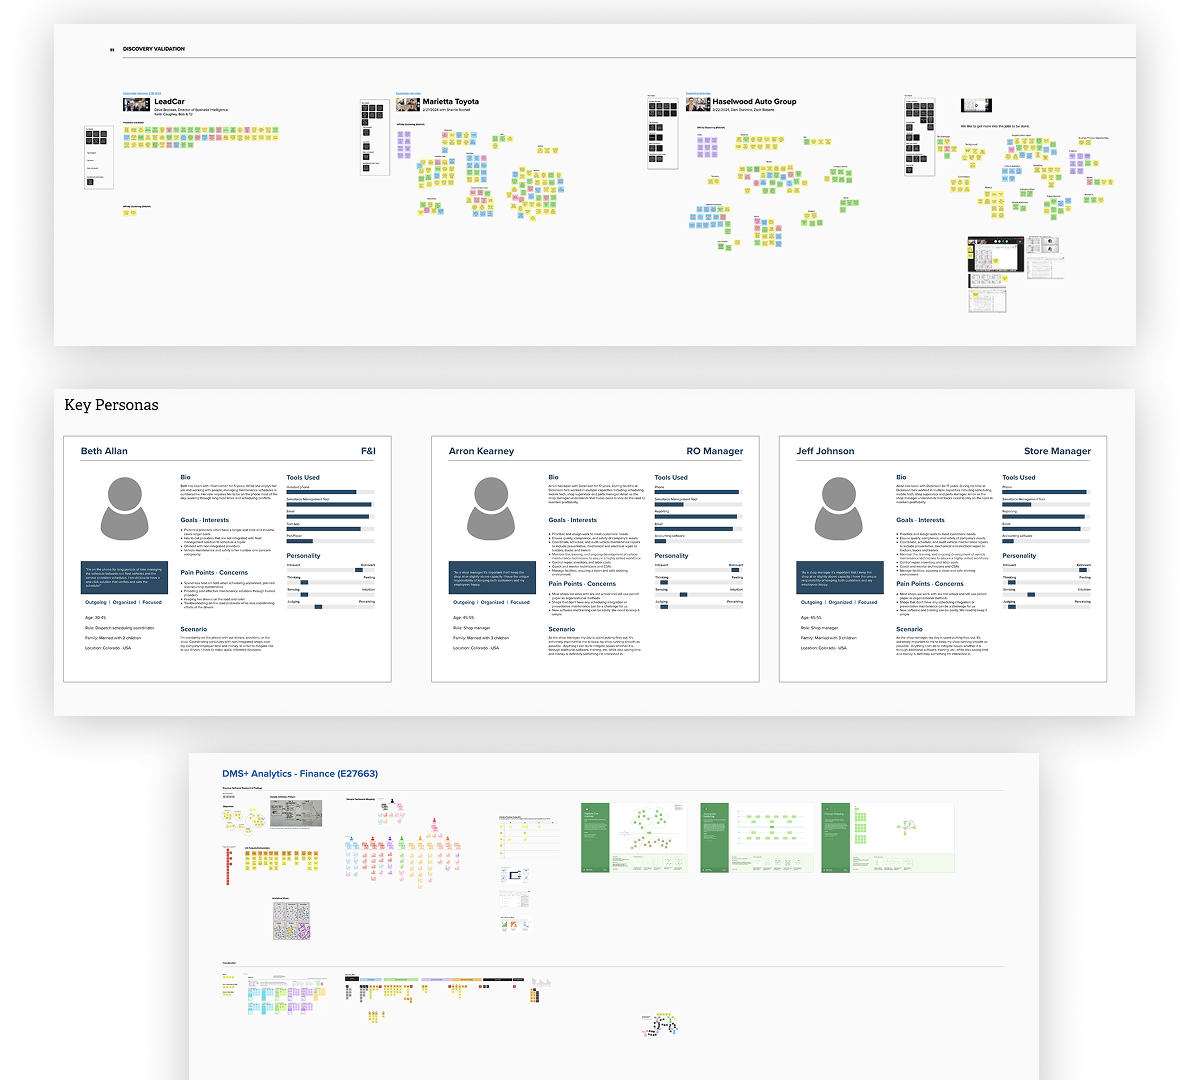
Research revealed dealership teams struggled less with access to data and more with:
- Inconsistent workflows
- Conflicting reporting behaviors
- Low confidence in operational metrics
- Fragmented navigation across systems
This shifted the initiative from "dashboard redesign" to "workflow-oriented operational reporting."
- Contextual inquiries with 5 dealerships
- HCD exercises with SMEs
- Store Managers
- F&I
- RO Managers
- Look-back availability
- Drill-downs, benchmarking, and anomaly detection
Users were overwhelmed by metrics but lacked prioritization and contextual guidance.
This created operational mistrust and manual reconciliation workflows.
Executives needed fast summaries while operational teams needed drill-down workflows.
Standardization reduced friction more than adding new reporting functionality.
Some stakeholders prioritized feature parity and data density, while operational users consistently prioritized clarity, prioritization, and trust.
I advocated for progressive disclosure and standardized workflows to reduce operational friction and improve decision confidence across dealership roles.
- Customization vs consistency
- Depth vs clarity
- Platform flexibility vs standardization
- Short-term delivery vs long-term scalability
- Progressive disclosure
- Role-based workflows
- Reusable reporting patterns
- Actionable summaries over data density
- Standardized filtering behaviors
- Scalable visualization systems
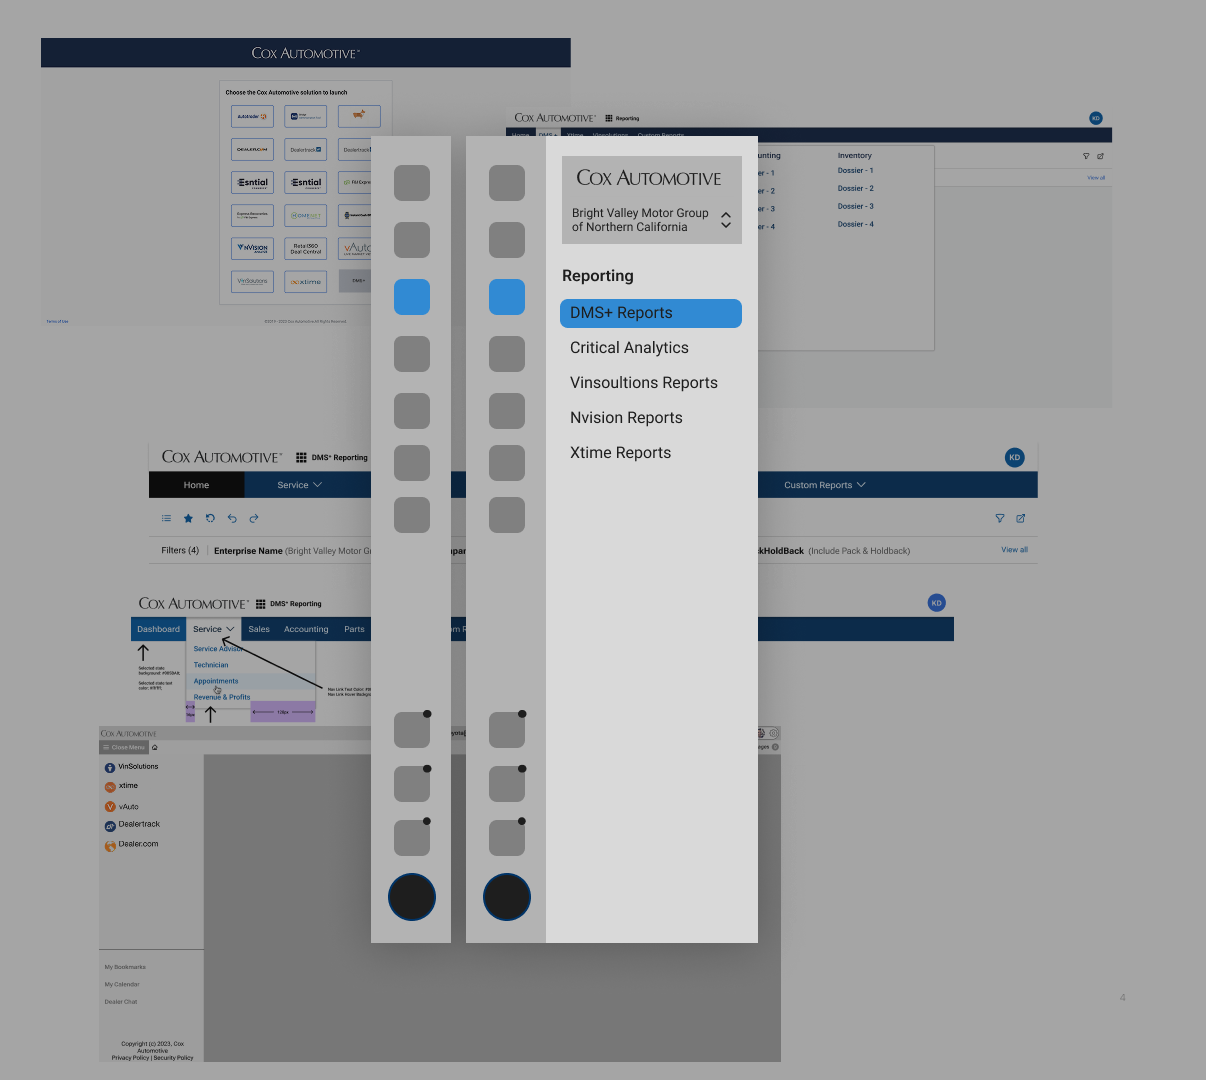
Cross-product navigation exposed too many reporting systems simultaneously.
Dealership users struggled to understand
- Where reports lived
- Which system owned what
- How workflows connected
Users thought in operational tasks, not product silos.
We moved from product-centric navigation to workflow-oriented reporting structures with progressive disclosure.
Reduced surface-level discoverability in exchange for clarity and reduced cognitive overload.
Early concepts prioritized maximum data visibility.
Users struggled to identify which metrics required action.
Dealership leaders needed prioritization and contextual guidance more than raw data exposure.
- KPI hierarchy
- Progressive disclosure
- Contextual summaries
- Standardized visualization patterns
Reduced simultaneous data exposure to improve speed-to-insight and operational clarity.
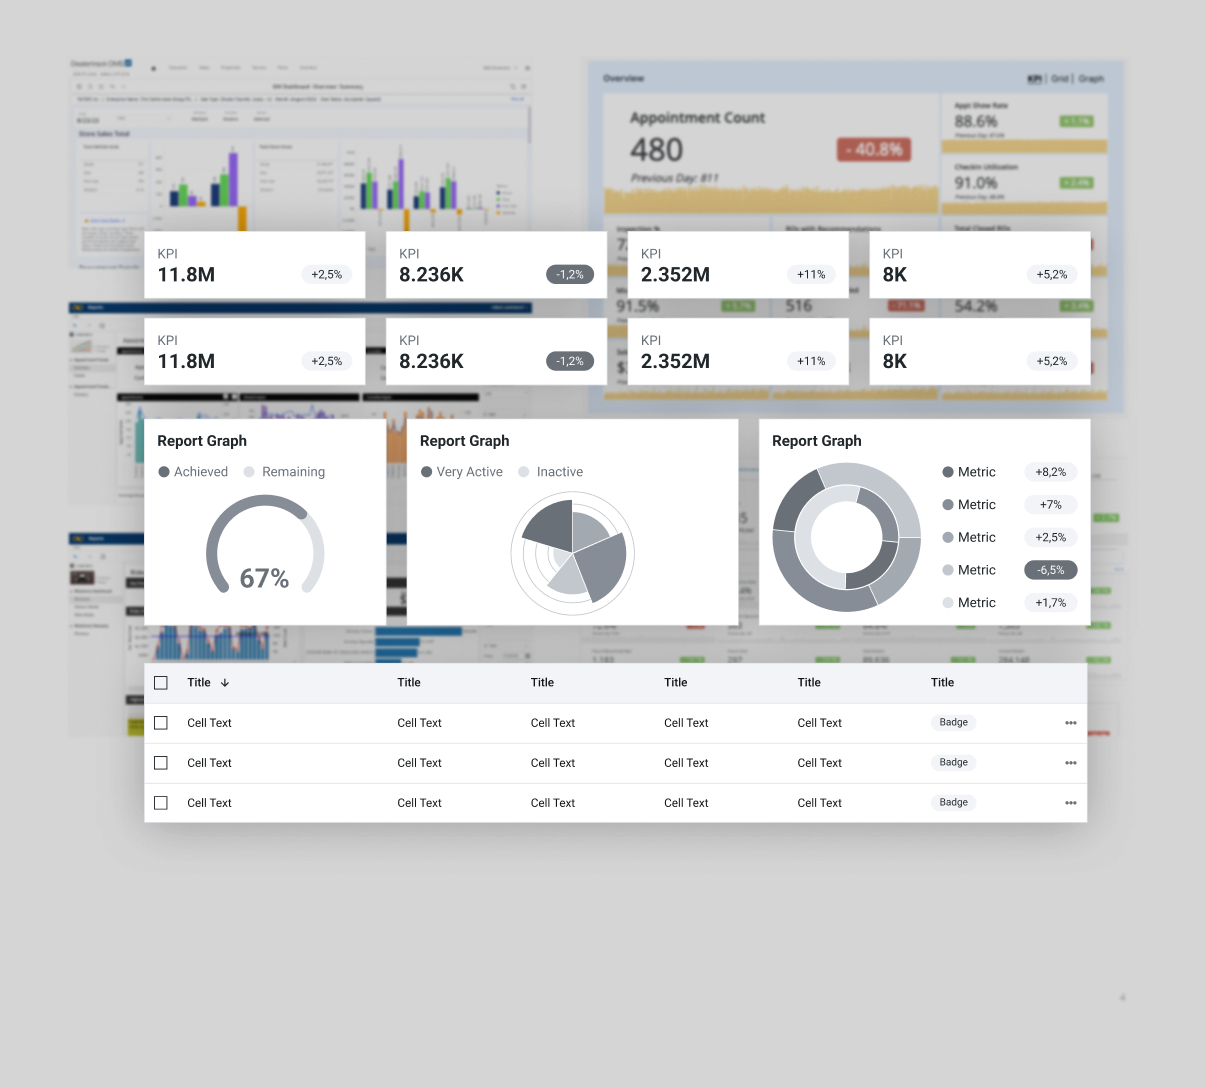
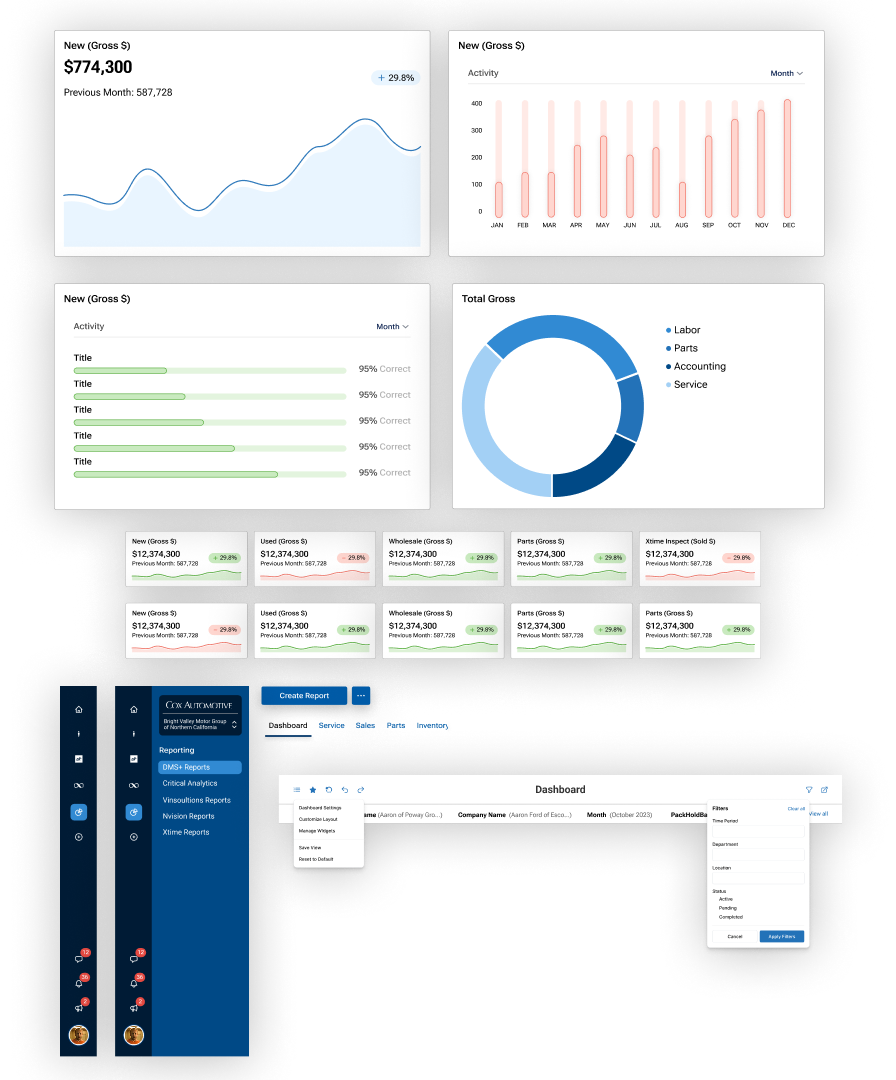
A major challenge was reducing cognitive load while maintaining the depth dealerships required to manage operations effectively.
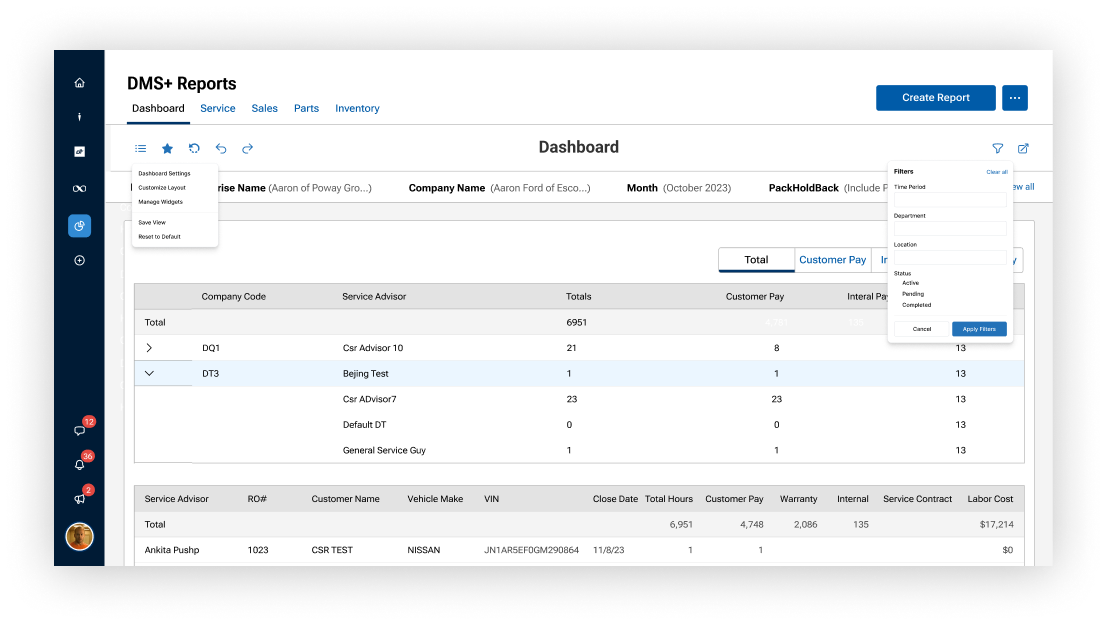
- Standardized chart behaviors
- Unified filtering systems
- Reusable grid patterns
- Consistent KPI structures
- Progressive drill-down experiences
- Scalable visualization standards
The goal was to create a reporting experience that felt predictable, learnable, and actionable regardless of product area.
This significantly reduced the friction created by inconsistent workflows across dealership systems.
The final experience consolidated fragmented reporting workflows into a unified ecosystem that supported dealership operations more consistently across departments and products.
- Quickly identify operational trends
- Navigate between summary and detailed views
- Compare metrics consistently across systems
- Move from reporting to operational action faster
The experience shifted reporting from static data presentation toward actionable decision support.
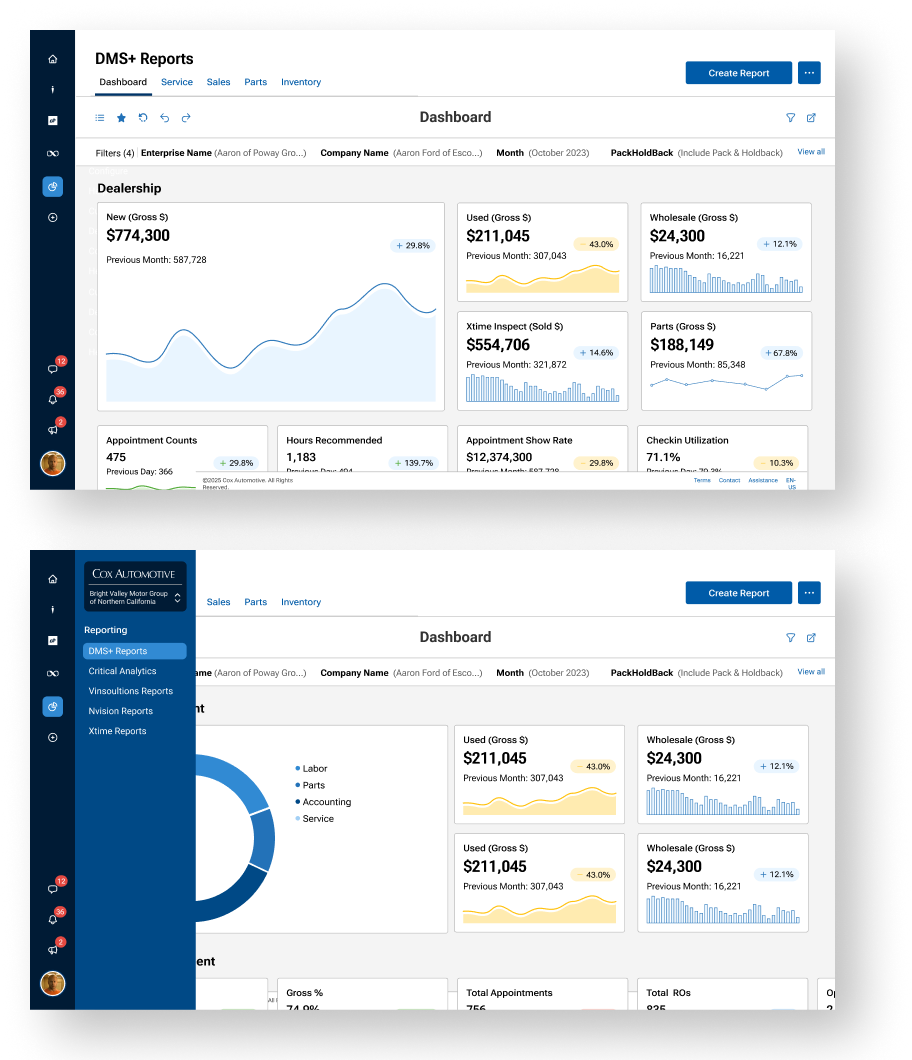
The initiative established a scalable reporting foundation across Cox Automotive's dealership ecosystem while improving consistency, usability, and operational visibility across products.
- Established a shared reporting framework through standardized patterns, KPI structures, and visualization principles
- Aligned product, engineering, and operational teams around a common reporting model
- Improved operational consistency with unified workflows and interaction patterns
- Enabled platform scalability through reusable reporting standards and frameworks
- Reduced complexity by consolidating fragmented reporting experiences into a cohesive ecosystem
- Accelerated future reporting initiatives with reusable patterns and shared foundations